Search for Web 2.0 Tools

Showing posts with label math. Show all posts

Thursday, January 2, 2014

Create graphs and charts using this Online Chart Tool.

The online ChartTool is another useful tool to use when trying to teach students about the different types of graphs and charts.  You can use this tool to create bar, line, area, and pie charts.  You can use it to graph X and Y coordinates, create scatter and bubble charts.  All you need to do is have your students is gather data and then plug it in to the different fields and in seconds you have an easy explain data chart.  In the tutorial below I will demonstrate just the bar chart, but just like all software the best way to understand its uses is to "play" with it yourself.
Free Image Hosting at www.ImageShack.us

1.  Go to http://www.onlinecharttool.com.  After you create a user name and are logged in just click the "Design your chart" button.


2.  Pick the type of chart you want to create.


3.  Now click the "Add Data" tab.


4.  Give your chart a title, describe your X and Y Axis.  The nice thing about the ChartTool is that you can also import CSV files if you are taking data from an existing source.


5.  Decide how many items and groups you are going to need.  Give each group a color and label.  Give each item a name and a value.  That value is what your students should have already researched.  Add your data set labels and their values.


6.  Don't forget to "Play" with the title options off to the right.  Then click the "Next" button.


7. On the "Labels and Fonts" tab you can now play with how you want your data labels to be.  Below you can also change the fonts.


8.  Now decided how big you would like your graph to be.  You should also be seeing a chart preview.  You may go back and fourth between tabs to change the fonts and colors as you want.


9.  On the "Save and Share" tab you can now save your chart in many different formats.  You can post it to Twitter, Facebook or Google Plus.  You can also email yourself the chart.  The way I do it, is have my students paste the image into a Google Doc and share it with me.  If you click the "Save Chart image online" option the ChartTool will give you an embed code to add to your website or blog.


Tuesday, November 26, 2013

Reteach and Remediate Math lessons using Hippo Campus

Hippo Campus is truly an excellent tool for helping teachers create reteach and remediate lesson for their students.  Hippo Campus has lessons that are interactive with video and exercises that are very well done.  The terminology used is excellent and easy to understand.  You can watch video of a teacher giving a graphic lesson and then practice the concept taught right away. 

The Math lessons range from basic comprehension of mathematical ideas all the way to higher Algebraic and Geometric concepts.   Hippo Campus also embeds some of the lessons straight from Kahn academy.

Your students can also "Launch" a lesson that can be tailored to them.

Also note that there are many more educational content areas that Hippo Campus has lessons but I find that their math content is the most extensive.  (Areas:  Biology, Chemistry, Physics, Earth Science, Economics, History, Psychology, Sociology, English, and Religion)

Below is a tutorial and a show and tell as to what you might find at Hippo Campus.


1.  Go to www.hippocampus.org

2.  On the left column you will see all of the mathematical concepts that you can learn and that have tutorials and guided practice.  In included the scroll bar so that you can see there are plenty more.


3.  Just click on any of the topics and you will get a list of sub-content.  For example if I click on "Developmental Math-Beginning Algebra" you will see,


4.  Now when you click on say "Solving Multi-Step Inequalities" you will get video that really does an excellent job a slowly speaking to student who might not currently understand the concept.
 
 
5.  Now if you want more than just a training tutorial click the "Launch a Course" button at the top.
 
 
6.  This will take you to a list of full semester courses with the same great content from above.
 
 
7.  Click on a course and then click the "Click to Launch" button.
 
 
8.  Your computer will now open up a new window with an entire course outline.  Click on any concept.


9.  You will now see another window open that contains a lesson, guided practice and review quiz over each mathematical concept.
 
 
I see students who struggle with math being able to go through a course and really get some extra help on difficult math concepts using Hippo Campus.


Monday, July 1, 2013

Video games in the classroom; useful or a waste of time?

Many times in my career as an educational technologist, I have come across advocates of playing video games as part of a class assignment.  I have always debated this idea both for the positive and the negative with colleagues and administrators.  I am still undecided with the idea of allowing games into the classroom.
Below is a Youtube video my son Dallin created.  He is 13 years old and plays Minecraft for a minimum of 2 hours a day and sometimes for much longer.  You should watch it.  He does an amazing job.  The problem is that he seems to border an addiction to Minecraft.

Here is a little bit of info for those who don't know what Minecraft is.  Basically it is a very low graphic style of gaming where players create an infinite amount of ideas by playing with blocks.  Who would have ever guessed that playing with blocks would become as famous as Minecraft?  Again watch the video below and you will be able to see what I am talking about.

Well back to my point.  My administrators came back from a conference where there was an advocate of bringing Minecraft into the classroom as part of the curriculum.  Even though my son has created a virtual world that is magnificent, extremely large, and architecturally amazing, would Minecraft be a tool that students could use to learn math, such as volume, area, perimeter, etc?  I have been asking my son for the last couple of years what the point of the game is; to which I still haven't received an answer that satisfies my question.  After all much of what he creates are zombie traps, and farm animals that he enjoys cooking with fire to make meat.

What do you, educators or students, think about the idea of bringing in a game like Minecraft into the classroom?  Would there be some educational value or would students waste a bunch of time making roast beef?

Saturday, June 22, 2013

Create graphs for your math class with this excellent web 2.0 graphing calculator tool

Attention all math teachers.  Have you ever wanted to create, print, and demonstrate graphs in your classroom?  If so then using Desmos would be an awesome web 2.0 tool for you to look into.  This graphing calculator can graph anywhere from simple to complex graphs.  Just add the formulas and the graph will appear quickly.  You can then save, print and share your graphs via email, website or your classroom blog.

Tutorial

1. Go to the following website:  www.desmos.com

2.  When you first arrive click the "Launch Calculator" button.


3.  On the left hand side, enter the mathematical formulas you want to demonstrate to your class.  You will notice your graph on the write appear as you type in the formula.


4.  If you want to save the graph, you will need a user login.  Just click the "Create" button at the top.  Now in the "Untitled Graph" text box found just above your graph.  Give your graph a title and click the "Save Graph" button. I also really like the fact that you can save the graph into your Google Drive which will then give you a whole bunch of different sharing methods.


5.  One of the really neat ideas about Desmos is that if you use a Smartboard in the classroom or any other type of Digital Whiteboard, you can use the input tool found at the bottom of the screen.  This will help you to continue to stand in front of the class while giving instructions on how to use the graph. 


6.  If you don't see the Desmos keyboard, then just locate the minimized button at the bottom that looks like the picture below.  Click it and the number pad will reappear.


7.  Now if you want to print or share you graph, just locate the options in blue at the top right corner of your screen under you login name.  To print, just click the "Print" icon.  To share just click the "Share" icon.


8.  After clicking the "Share" icon, you will first see a link that you can use to link to your graph.  If you would like to embed the graph into your blog or website, just click the "Embed" button and then copy and paste the code into the HTML portion of your website.  An example of an embedded image is at the very end of this blog post.  Finally you can click the "Image" button which will allow you to save the image so that you can use it wherever you would like.


9.  Just past the print and share buttons is the "wrench" or "settings" button.  This will give you some advance options for your graph.  One of the options that is a fantastic idea is the "Projector Mode" button.  This will make the lines of your graph darker and thicker so that the lines are more visible to your students.


Desmos is truly an easy solution for demonstrating how to graph.  Get as complex as you want.

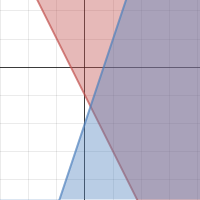
Here is an example of an embedded graph from Desmos.

Saturday, January 12, 2013

Learn Math and English Language concepts using Learnzillion.

I found this great site today called Learnzillion.  They have done a great job creating animated video tutorials in the subjects of Math and English from grades two to twelve.  They only have about 2000 videos now, but the potential with what they are trying to achieve is huge.  If Learnzillion continues creating easy and comprehensive videos for teachers and students to use in the classroom, then they will become a great resource for those students who are struggling with math and English.  In fact they are recruiting 200 more teachers this summer to create videos for more of the Common Core standards.

Tutorial

1.  Go to www.learnzillion.com and create an account; its free.

2.  At the top you will see the different tabs that can go to.  You can just go out and explore the different lessons or you can find them by the Common Core standard.  You can even create a list of favorites.  


3.  Click on the "Classes" tab if you want to create a class and enroll students.  The advantage of creating a class and adding students is that your students can get an Enrollment Code which will give them easy access to the sites content.


4.  If you click on the "Explore lessons" tab you can go straight to the videos themselves.  Decide whether to view Math or ELA content by clicking on the respective tabs.


5.  Now choose the grade level that you are teaching so that your movie selections are narrowed down a little bit.


6.  The drop down box under "Domains" will give you the different sections of the subject that are available.  Remember that after this summer they should have quite a few more completed.  To actually go straight to a Common Core standard just select the "Choose a standard" drop down box.


7.  Off to the right you should see videos that related to the grade level, domain, and standard.  Just click on the "Core Lesson" box and this will take you to the actual lesson that contains the video.


8.  Dead center is your video.  Just click on it to get it to play.  NOTE:  I tried to use Google Chrome first and the video wouldn't play.  Using Internet Explorer worked best for the entire site.  Now off to the right you can actually download the slides that teach the lesson for some offline viewing.  The Coach's commentary will let you watch a short video as to how the lesson presenter goes about teaching the specific lesson.  The Guided practice section is awesome, because it contains a video with multiple examples of the lesson.


9.  Off to the left of the main lesson video you can see the related videos that contain more content about this particular lesson and standard.

Wednesday, July 4, 2012

Create simple data charts using ChartTool

This is my third blog post discussing different web 2.0 methods of collecting, analyzing, and then visually displaying data that is collected with your students.  Sure you can use a computer spreadsheet to do the same thing, but some of the online methods are just too easy to use, free, and a lot less hassle than using Excel or a similar spreadsheet program.

I would like to highlight a new one that I found called ChartTool.  With ChartTool you can create many of the common types of charts and graphs found in math or science classrooms.  All you have to do is input your collected data and then generate the chart.

Advantages of using ChartTool

  • Create bar, line, area, pie, radar, scatter plots, bubble, meter, and line bar graphs.
  • You don't need a login to use the tool.
  • Custom create the way your chart looks in terms of font size and color.

Disadvantages
  • I did not see a method of actually being able to embed the chart into your blog or website.  You can however save your finished chart by printing, or saving it as a picture.

Tutorial

1.  Click on the following link  http://www.onlinecharttool.com

2.  Click on the "Graph" tab found at the top of the website.

3.  Select the type of graph you want your classes to create.


4.  Each graph type will be different than this picture because each chart type have unique properties.  In this example I am creating a "Line Graph."  


5.  Click the green "Arrow" button to go to the next page.


6.  Now it is time choose how you want the graph to look and to add you collected data into the chart.  Just play with the different options for the title.  Next give your chart a title, label the x axis and the y axis.   Remember the x axis is the up and down/vertical part of the chart and the y axis goes across your screen.  Decided how many data sets you have.  Give color to your chart and then add your data and their values to the chart.


7.  In this section you can play with some more variable to customize your chart.


8.  Click the green arrow again and you can now see what your chart looks like.


9.  Finally you can save your graph into a few different formats or just email the graph to somebody.  


Again ChartTool another simple method of taking data that you are collecting, inputting it into the website and then getting instant results and graphs.

Wednesday, December 7, 2011

Graphing Math Functions on Google

Google has come out with a new math graphing functionality. When a user types a function into the search bar, a graph will appear that can be analyzed.

For example, if a user types sin(x), here is what shows up:


The user can mouse over any part of the graph to see what the exact x and y coordinates are.

A user can also type in more than one function:


Here is the link to the original entry on the Google search blog.

Happy graphing!