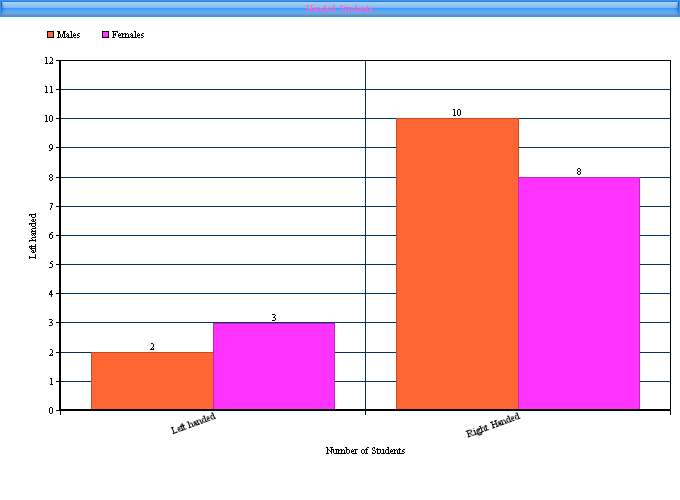
The online ChartTool is another useful tool to use when trying to teach students about the different types of graphs and charts. You can use this tool to create bar, line, area, and pie charts. You can use it to graph X and Y coordinates, create scatter and bubble charts. All you need to do is have your students is gather data and then plug it in to the different fields and in seconds you have an easy explain data chart. In the tutorial below I will demonstrate just the bar chart, but just like all software the best way to understand its uses is to "play" with it yourself.

1. Go to http://www.onlinecharttool.com. After you create a user name and are logged in just click the "Design your chart" button.
2. Pick the type of chart you want to create.
3. Now click the "Add Data" tab.
4. Give your chart a title, describe your X and Y Axis. The nice thing about the ChartTool is that you can also import CSV files if you are taking data from an existing source.
5. Decide how many items and groups you are going to need. Give each group a color and label. Give each item a name and a value. That value is what your students should have already researched. Add your data set labels and their values.
6. Don't forget to "Play" with the title options off to the right. Then click the "Next" button.
7. On the "Labels and Fonts" tab you can now play with how you want your data labels to be. Below you can also change the fonts.
8. Now decided how big you would like your graph to be. You should also be seeing a chart preview. You may go back and fourth between tabs to change the fonts and colors as you want.
9. On the "Save and Share" tab you can now save your chart in many different formats. You can post it to Twitter, Facebook or Google Plus. You can also email yourself the chart. The way I do it, is have my students paste the image into a Google Doc and share it with me. If you click the "Save Chart image online" option the ChartTool will give you an embed code to add to your website or blog.


How to Play Baccarat - Online Casinos - Wolverione
ReplyDeletePlay the game of baccarat at the leading online casino on your Android or Windows 실시간 바카라 사이트 승리바카라 PC. We have the widest variety of games to choose from.